Dashboard
The project dashboard is a very important part of GPT. It displays several KPIs regarding the status of the data files that have been, or will be, imported in the GIS server.
From this page, the user can use a drop-down to select either:
The current/last run dashboard
The project status dashboard
Current & Last Run Dashboard
The current run dashboard gives the user statistics related to the files that are being processed in an ongoing run.
This dashboard contains information only related to the import sets included in the run. All the other import sets do not participate in the data being displayed.
Once the processing completes, we refer to the last run dashboard, which represents the statistics related to the last time a run was launched.
The current run dashboard continuously refreshes itself to show the user the status of the run.
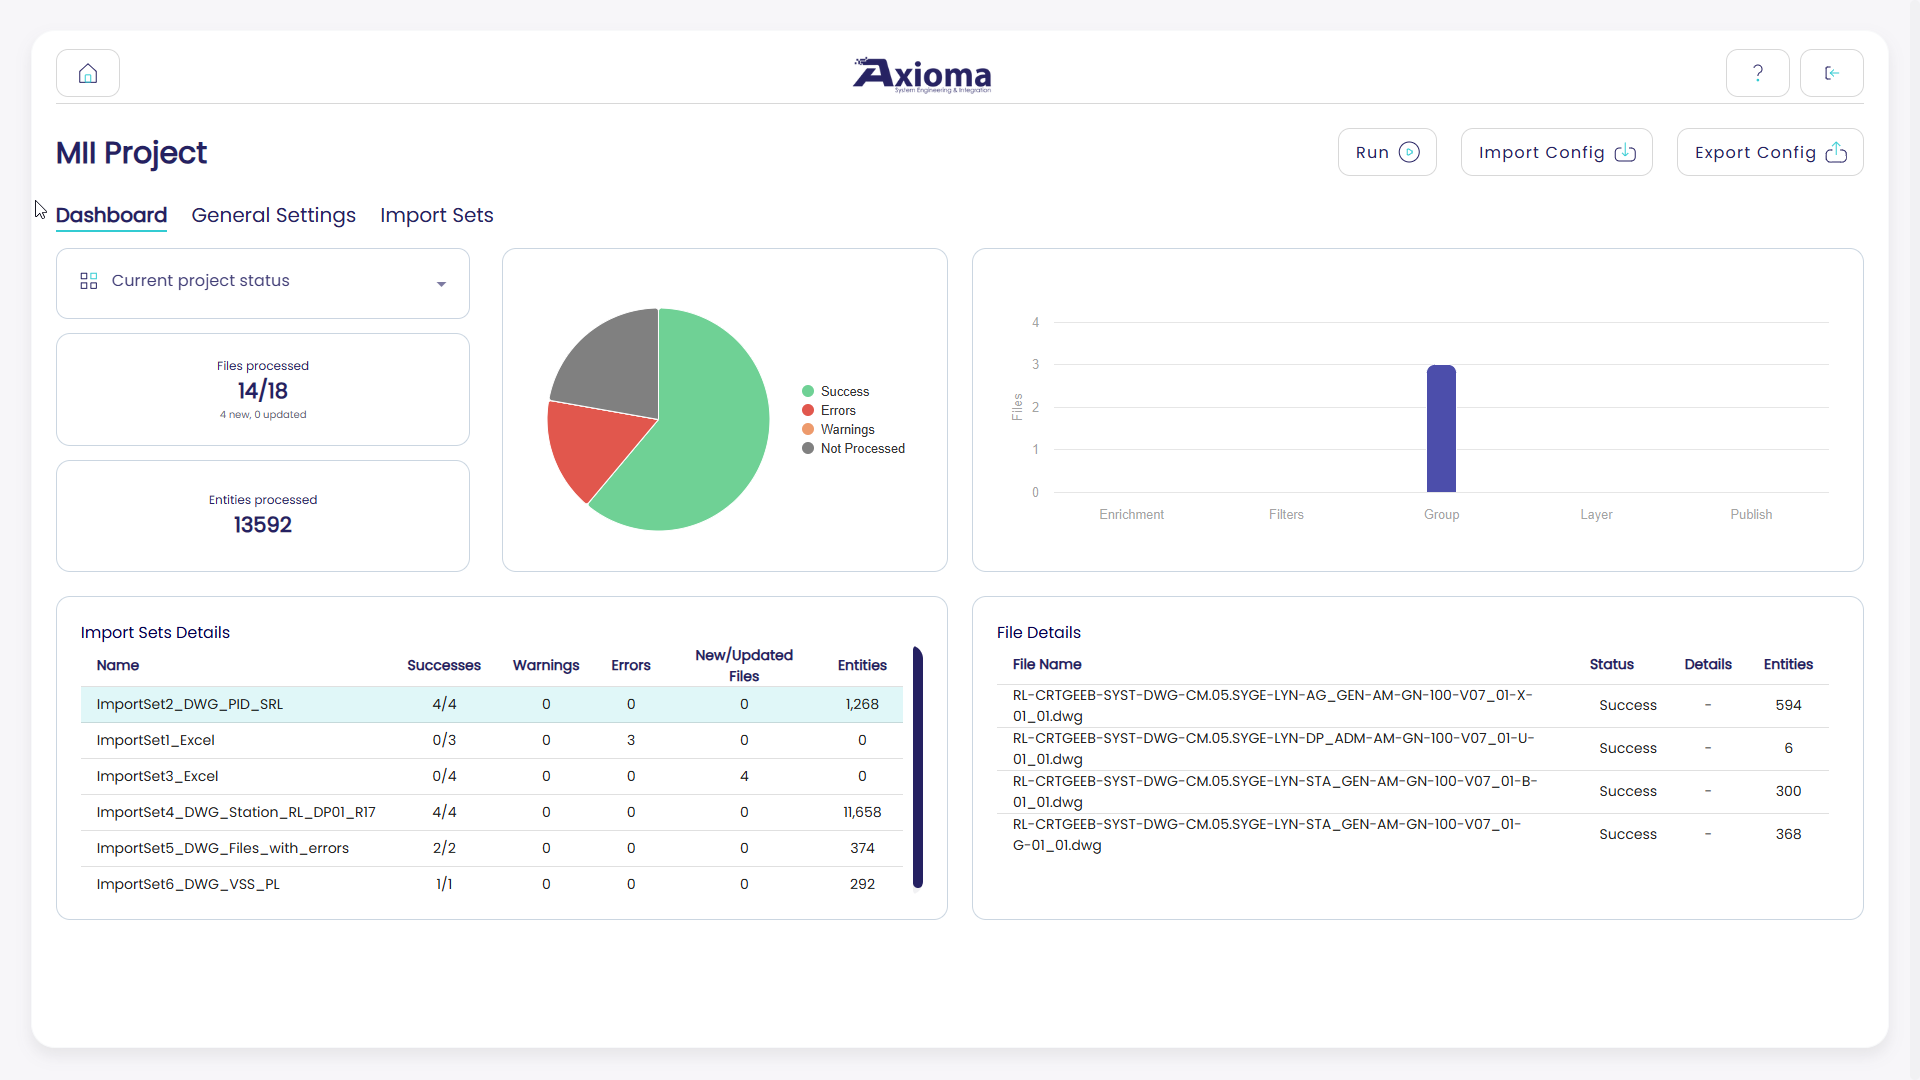
Via this dashboard, the user can observe the following KPIs:
How many files were processed, out of the total number of files to be processed.
Of the total number of files to process, the KPI also mentions how many of these are new or modified since the last processing.
How many entities were processed.
How many files were processed successfully, how many with an error, what type of error occurred, and how many with a warning.
A warning state means that the file was processed, but with some missing information, such as an enrichment that failed. For both errors and warnings, the dashboard provides descriptive details of the occurred problem.
Important
To have an accurate understanding of the dashboard KPIs, it is important to understand what type of run the dashboard displays: full or differential.
For example, the files to be processed in a full run represent the total number of processable files, while in a differential run they represent only the new and updated files.
Project Status Dashboard
The Project Status Dashboard has two main differences with respect to the Current/Last Run Dashboard:
It is static, with no continuous refresh.
It contains information about all the project’s import sets.
Other than the above differences, this dashboard provides the same type of KPIs as the Current/Last Run Dashboard.